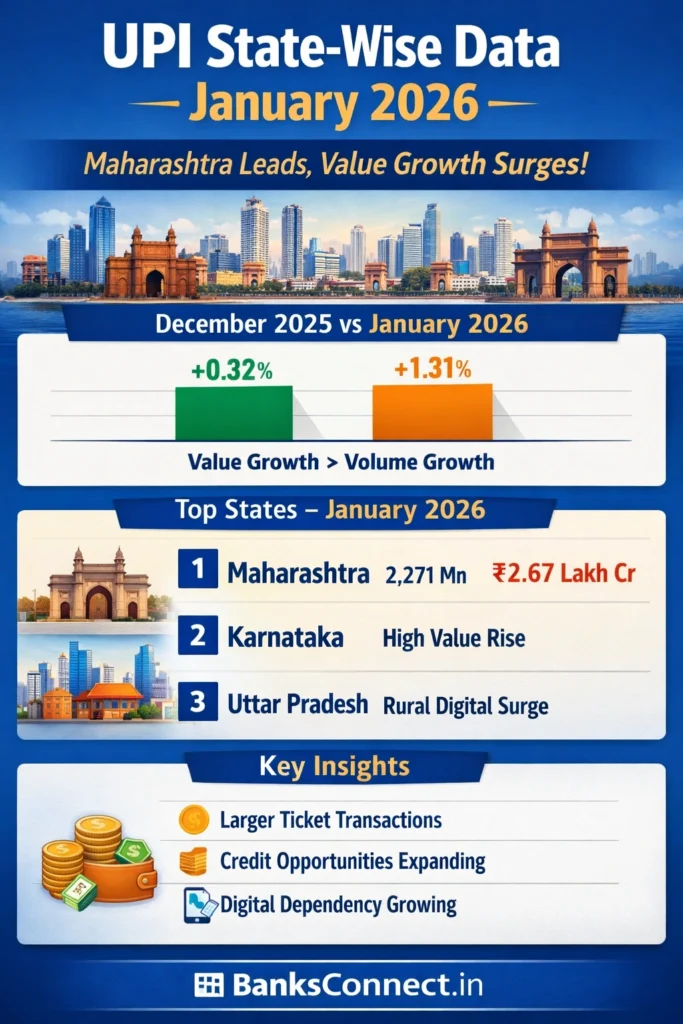
India’s digital payments engine continues to show structural strength. The latest state-wise UPI statistics for January 2026, released by the National Payments Corporation of India (NPCI), not only highlight regional leaders but also reveal an important shift: value growth is stronger than volume growth.
That tells us something crucial — UPI is maturing.
In this detailed analysis, we compare December 2025 vs January 2026, examine top-performing states, and decode what the numbers mean for banks, fintechs, and policymakers.
📊 January 2026 Snapshot – Who’s Leading?
🥇 Maharashtra – Still the UPI Powerhouse
January 2026 Performance:
- Volume: 2,271.25 Million transactions
- Volume Share: 10.46%
- Value: ₹2,67,028.17 Crore
- Value Share: 9.42%
What Changed vs December 2025?
- Volume: ↓ 3.33% (festive normalization)
- Value: ↑ 1.26%
🔎 Insight: Fewer transactions than December, but higher transaction value.
This suggests larger ticket payments, possibly business-linked or higher retail spends.
Maharashtra remains the digital capital of India due to:
- Mumbai’s financial ecosystem
- High merchant density
- Strong fintech presence
- Corporate-linked transactions
🥈 Karnataka – Tech Economy Driving Value
January 2026 Performance:
- Volume: 1,165.05 Million
- Value: ₹1,64,652.55 Crore
December vs January Trend:
- Volume: ↓ 0.11%
- Value: ↑ 1.46%
🔎 Karnataka shows stability in transaction count but clear growth in value.
This reflects:
- Digital commerce
- Startup ecosystem strength
- High-value consumer spending
- Strong UPI acceptance in organized retail
Bengaluru’s digital culture continues to influence the state’s payment behavior.
🥉 Uttar Pradesh – Digital Inclusion in Action
January 2026 Performance:
- Volume: 1,130.54 Million
- Value: ₹1,53,987.10 Crore
While December saw festive strength, January showed moderate normalization. However, UP maintains a strong national share.
🔎 What makes UP important?
- Largest population base
- Expanding rural UPI adoption
- Government DBT ecosystem
- Growth in Tier-2 & Tier-3 cities
UP proves that UPI is no longer metro-centric.
📈 National Trend: December 2025 vs January 2026
🇮🇳 Overall India Growth (MoM)
- Volume Growth: +0.32%
- Value Growth: +1.31%
What This Means:
1️⃣ December festive spike normalized in January
2️⃣ Value growth outpaced volume growth
3️⃣ Average transaction size is increasing
4️⃣ UPI usage is becoming structural, not seasonal
This is a sign of ecosystem maturity.
🔍 Deeper Analysis: Volume vs Value Gap
Understanding this difference is critical for bankers.
When Volume Drops but Value Rises:
- Higher ticket transactions
- More business-linked payments
- Digital migration of larger spends
- Growing trust in UPI for bigger payments
States like Maharashtra and Karnataka show exactly this pattern.
This shift supports credit-on-UPI models and digital lending expansion.
🏦 What It Means for Banks & Fintech Companies
For professionals tracking digital banking trends:
1️⃣ Merchant Acquisition Strategy
Focus on high-volume states for QR expansion.
2️⃣ credits on UPI
Higher value transactions indicate:
- Eligibility for micro-credit
- Strong repayment behavior tracking
- Cash-flow based lending potential
3️⃣ Regional Strategy
State-wise data allows:
- Geo-targeted marketing
- State-specific fintech expansion
- Data-driven growth planning
With support from the Reserve Bank of India (RBI), UPI continues to evolve as national payment infrastructure.
🚀 Why January 2026 Is Important
January is typically a normalization month after December’s festive surge.
Yet, India maintained:
- Stable volumes
- Strong value growth
- Consistent regional leadership
- Deep rural participation
This shows digital payments in India are now habit-driven, not event-driven.
📌 Key Takeaways
✔ Maharashtra remains the undisputed leader
✔ Southern states continue to dominate digital culture
✔ UP highlights rural inclusion strength
✔ Value growth stronger than volume growth
✔ UPI ecosystem entering maturity phase
India is transitioning from digital adoption to digital dependency.